Visualizations—visual representations of information, depicted in graphics—are studied by researchers in numerous ways, ranging from the study of the basic principles of creating visualizations, to the cognitive processes underlying their use, as well as how visualizations communicate complex information (such as in medical risk or spatial patterns). However, findings from different domains are rarely shared across domains though there may be domain-general principles underlying visualizations and their use. The limited cross-domain communication may be due to a lack of a unifying cognitive framework. This review aims to address this gap by proposing an integrative model that is grounded in models of visualization comprehension and a dual-process account of decision making. We review empirical studies of decision making with static two-dimensional visualizations motivated by a wide range of research goals and find significant direct and indirect support for a dual-process account of decision making with visualizations. Consistent with a dual-process model, the first type of visualization decision mechanism produces fast, easy, and computationally light decisions with visualizations. The second facilitates slower, more contemplative, and effortful decisions with visualizations. We illustrate the utility of a dual-process account of decision making with visualizations using four cross-domain findings that may constitute universal visualization principles. Further, we offer guidance for future research, including novel areas of exploration and practical recommendations for visualization designers based on cognitive theory and empirical findings.
People use visualizations to make large-scale decisions, such as whether to evacuate a town before a hurricane strike, and more personal decisions, such as which medical treatment to undergo. Given their widespread use and social impact, researchers in many domains, including cognitive psychology, information visualization, and medical decision making, study how we make decisions with visualizations. Even though researchers continue to develop a wealth of knowledge on decision making with visualizations, there are obstacles for scientists interested in integrating findings from other domains—including the lack of a cognitive model that accurately describes decision making with visualizations. Research that does not capitalize on all relevant findings progresses slower, lacks generalizability, and may miss novel solutions and insights. Considering the importance and impact of decisions made with visualizations, it is critical that researchers have the resources to utilize cross-domain findings on this topic. This review provides a cognitive model of decision making with visualizations that can be used to synthesize multiple approaches to visualization research. Further, it offers practical recommendations for visualization designers based on the reviewed studies while deepening our understanding of the cognitive processes involved when making decisions with visualizations.
Every day we make numerous decisions with the aid of visualizations, including selecting a driving route, deciding whether to undergo a medical treatment, and comparing figures in a research paper. Visualizations are external visual representations that are systematically related to the information that they represent (Bertin, 1983; Stenning & Oberlander, 1995). The information represented might be about objects, events, or more abstract information (Hegarty, 2011). The scope of the previously mentioned examples illustrates the diversity of disciplines that have a vested interest in the influence of visualizations on decision making. While the term decision has a range of meanings in everyday language, here decision making is defined as a choice between two or more competing courses of action (Balleine, 2007).
We argue that for visualizations to be most effective, researchers need to integrate decision-making frameworks into visualization cognition research. Reviews of decision making with visual-spatial uncertainty also agree there has been a general lack of emphasis on mental processes within the visualization decision-making literature (Kinkeldey, MacEachren, Riveiro, & Schiewe, 2017; Kinkeldey, MacEachren, & Schiewe, 2014). The framework that has dominated applied decision-making research for the last 30 years is a dual-process account of decision making. Dual-process theories propose that we have two types of decision processes: one for automatic, easy decisions (Type 1); and another for more contemplative decisions (Type 2) (Kahneman & Frederick, 2002; Stanovich, 1999). Footnote 1 Even though many research areas involving higher-level cognition have made significant efforts to incorporate dual-process theories (Evans, 2008), visualization research has yet to directly test the application of current decision-making frameworks or develop an effective cognitive model for decision making with visualizations. The goal of this work is to integrate a dual-process account of decision making with established cognitive frameworks of visualization comprehension.
In this paper, we present an overview of current decision-making theories and existing visualization cognition frameworks, followed by a proposal for an integrated model of decision making with visualizations, and a selective review of visualization decision-making studies to determine if there is cross-domain support for a dual-process account of decision making with visualizations. As a preview, we will illustrate Type 1 and 2 processing in decision making with visualizations using four cross-domain findings that we observed in the literature review. Our focus here is on demonstrating how dual-processing can be a useful framework for examining visualization decision-making research. We selected the cross-domain findings as relevant demonstrations of Type 1 and 2 processing that were shared across the studies reviewed, but they do not represent all possible examples of dual-processing in visualization decision-making research. The review documents each of the cross-domain findings, in turn, using examples from studies in multiple domains. These cross-domain findings differ in their reliance on Type 1 and Type 2 processing. We conclude with recommendations for future work and implications for visualization designers.
Decision-making researchers have pursued two dominant research paths to study how humans make decisions under risk. The first assumes that humans make rational decisions, which are based on weighted and ordered probability functions and can be mathematically modeled (e.g. Kunz, 2004; Von Neumann, 1953). The second proposes that people often make intuitive decisions using heuristics (Gigerenzer, Todd, & ABC Research Group, 2000; Kahneman & Tversky, 1982). While there is fervent disagreement on the efficacy of heuristics and whether human behavior is rational (Vranas, 2000), there is more consensus that we can make both intuitive and strategic decisions (Epstein, Pacini, Denes-Raj, & Heier, 1996; Evans, 2008; Evans & Stanovich, 2013; cf. Keren & Schul, 2009). The capacity to make intuitive and strategic decisions is described by a dual-process account of decision making, which suggests that humans make fast, easy, and computationally light decisions (known as Type 1 processing) by default, but can also make slow, contemplative, and effortful decisions by employing Type 2 processing (Kahneman, 2011). Various versions of dual-processing theory exist, with the key distinctions being in the attributes associated with each type of process (for a more detailed review of dual-process theories, see Evans & Stanovich, 2013). For example, older dual-systems accounts of decision making suggest that each process is associated with specific cognitive or neurological systems. In contrast, dual-process (sometimes termed dual-type) theories propose that the processes are distinct but do not necessarily occur in separate cognitive or neurological systems (hence the use of process over system) (Evans & Stanovich, 2013).
Identifying processes that require significant working memory provides a definition of Type 2 processing with observable neural correlates. Therefore, in line with Evans and Stanovich (2013), in the remainder of this manuscript, we will use significant working memory capacity demands and significant need for cognitive control, as defined above, as the criterion for Type 2 processing. In the context of visualization decision making, processes that require significant working memory are those that depend on the deliberate application of working memory to function. Type 1 processing occurs outside of users’ conscious awareness and may utilize small amounts of working memory but does not rely on conscious processing in working memory to drive the process. It should be noted that Type 1 and 2 processing are not mutually exclusive and many real-world decisions likely incorporate all processes. This review will attempt to identify tasks in visualization decision making that require significant working memory and capacity (Type 2 processing) and those that rely more heavily on Type 1 processing, as a first step to combining decision theory with visualization cognition.
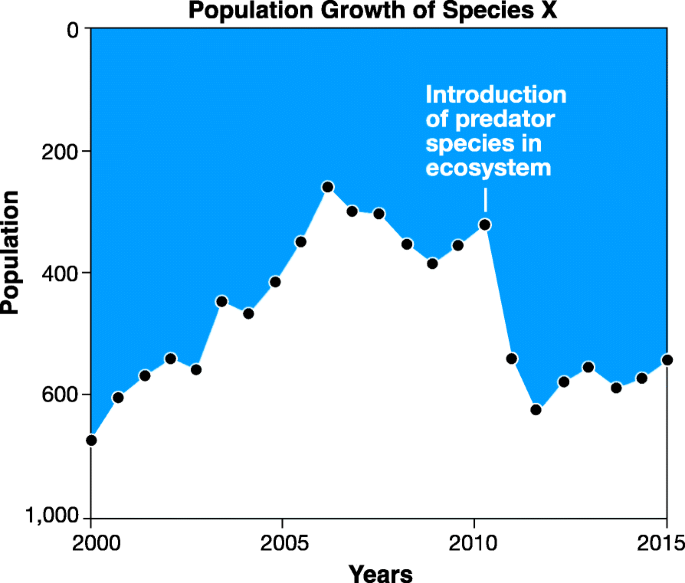
Visualization cognition is a subset of visuospatial reasoning, which involves deriving meaning from external representations of visual information that maintain consistent spatial relations (Tversky, 2005). Broadly, two distinct approaches delineate visualization cognition models (Shah, Freedman, & Vekiri, 2005). The first approach refers to perceptually focused frameworks which attempt to specify the processes involved in perceiving visual information in displays and make predictions about the speed and efficiency of acquiring information from a visualization (e.g. Hollands & Spence, 1992; Lohse, 1993; Meyer, 2000; Simkin & Hastie, 1987). The second approach considers the influence of prior knowledge as well as perception. For example, Cognitive Fit Theory (Vessey, 1991), suggests that the user compares a learned graphic convention (mental schema) to the visual depiction. Visualizations that do not match the mental schema require cognitive transformations to make the visualization and mental representation align. For example, Fig. 2 illustrates a fictional relationship between the population growth of Species X and a predator species. At first glance, it may appear that when the predator species was introduced that the population of Species X dropped. However, after careful observation, you may notice that the higher population values are located lower on the Y-axis, which does not match our mental schema for graphs. With some effort, you can mentally reorder the values on the Y-axis to match your mental schema and then you may notice that the introduction of the predator species actually correlates with growth in the population of Species X. When the viewer is forced to mentally transform the visualization to match their mental schema, processing steps are increased, which may increase errors, time to complete a task, and demand on working memory (Vessey, 1991).
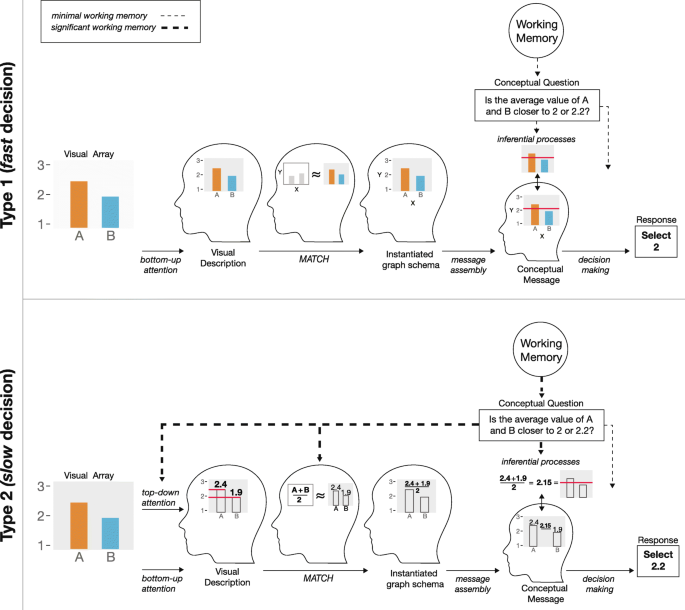
Pinker (1990) proposed a cognitive model (see Fig. 3), which provides an integrative structure that denotes the distinction between top-down and bottom-up encoding mechanisms in understanding data graphs. Researchers have generalized this model to propose theories of comprehension, learning, and memory with visual information (Hegarty, 2011; Kriz & Hegarty, 2007; Shah & Freedman, 2011). The Pinker (1990) model suggests that from the visual array, defined as the unprocessed neuronal firing in response to visualizations, bottom-up encoding mechanisms are utilized to construct a visual description, which is the mental encoding of the visual stimulus. Following encoding, viewers mentally search long-term memory for knowledge relevant for interpreting the visualization. This knowledge is proposed to be in the form of a graph schema.
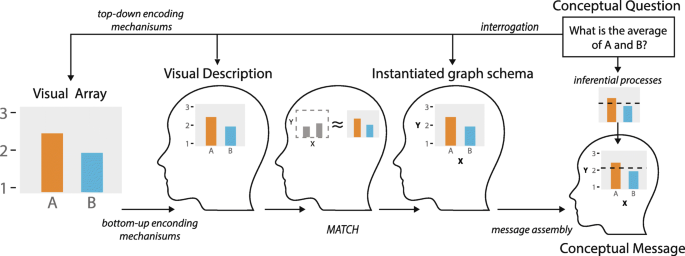
Then viewers use a match process, where the graph schema that is the most similar to the visual array is retrieved. When a matching graph schema is found, the schema becomes instantiated. The visualization conventions associated with the graph schema can then help the viewer interpret the visualization (message assembly process). For example, Fig. 3 illustrates comprehension of a bar chart using the Pinker (1990) model. In this example, the matched graph schema for a bar graph specifies that the dependent variable is on the Y-axis and the independent variable is on the X-axis; the instantiated graph schema incorporates the visual description and this additional information. The conceptual message is the resulting mental representation of the visualization that includes all supplemental information from long-term memory and any mental transformations the viewer may perform on the visualization. Viewers may need to transform their mental representation of the visualization based on their task or conceptual question. In this example, the viewer’s task is to find the average of A and B. To do this, the viewer must interpolate information in the bar chart and update the conceptual message with this additional information. The conceptual question can guide the construction of the mental representation through interrogation, which is the process of seeking out information that is necessary to answer the conceptual question. Top-down encoding mechanisms can influence each of the processes.
The influences of top-down processes are also emphasized in a previous attempt by Patterson et al. (2014) to extend visualization cognition theories to decision making. The Patterson et al. (2014) model illustrates how top-down cognitive processing influences encoding, pattern recognition, and working memory, but not decision making or the response. Patterson et al. (2014) use the multicomponent definition of working memory, proposed by Baddeley and Hitch (1974) and summarized by Cowan (2017) as a “multicomponent system that holds information temporarily and mediates its use in ongoing mental activities” (p. 1160). In this conception of working memory, a central executive controls the functions of working memory. The central executive can, among other functions, control attention and hold information in a visuo-spatial temporary store, which is where information can be maintained temporally for decision making without being stored in long-term memory (Baddeley & Hitch, 1974).
While incorporating working memory into a visualization decision-making model is valuable, the Patterson et al. (2014) model leaves some open questions about relationships between components and processes. For example, their model lacks a pathway for working memory to influence decisions based on top-down processing, which is inconsistent with well-established research in decision science (e.g. Gigerenzer & Todd, 1999; Kahneman & Tversky, 1982). Additionally, the normal processing pathway, depicted in the Patterson model, is an oversimplification of the interaction between top-down and bottom-up processing that is documented in a large body of literature (e.g. Engel, Fries, & Singer, 2001; Mechelli, Price, Friston, & Ishai, 2004).
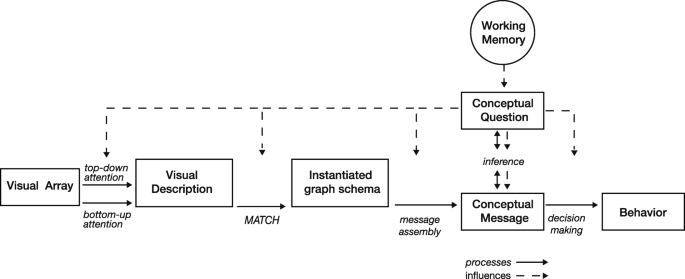
Our proposed model (Fig. 4) introduces a dual-process account of decision making (Evans & Stanovich, 2013; Gigerenzer & Gaissmaier, 2011; Kahneman, 2011) into the Pinker (1990) model of visualization comprehension. A primary addition of our model is the inclusion of working memory, which is utilized to answer the conceptual question and could have a subsequent impact on each stage of the decision-making process, except bottom-up attention. The final stage of our model includes a decision-making process that derives from the conceptual message and informs behavior. In line with a dual-process account (Evans & Stanovich, 2013; Gigerenzer & Gaissmaier, 2011; Kahneman, 2011), the decision step can either be completed with Type 1 processing, which only uses minimal working memory (Evans & Stanovich, 2013) or recruit significant working memory, constituting Type 2 processing. Also following Evans and Stanovich (2013), we argue that people can make a decision with a visualization while using minimal amounts of working memory. We classify this as Type 1 thinking. Lohse (1997) found that when participants made judgments about budget allocation using profit charts, individuals with less working memory capacity performed equally well compared to those with more working memory capacity, when they only made decisions about three regions (easier task). However, when participants made judgments about nine regions (harder task), individuals with more working memory capacity outperformed those with less working memory capacity. The results of the study reveal that individual differences in working memory capacity only influence performance on complex decision-making tasks (Lohse, 1997). Figure 5 (top) illustrates one way that a viewer could make a Type 1 decision about whether the average value of bars A and B is closer to 2 or 2.2. Figure 5 (top) illustrates how a viewer might make a fast and computationally light decision in which she decides that the middle point between the two bars is closer to the salient tick mark of 2 on the Y-axis and answers 2 (which is incorrect). In contrast, Fig. 5 (bottom) shows a second possible method of solving the same problem by utilizing significant working memory (Type 2 processing). In this example, the viewer has recently learned a strategy to address similar problems, uses working memory to guide a top-down attentional search of the visual array, and identifies the values of A and B. Next, she instantiates a different graph schema than in the prior example by utilizing working memory and completes an effortful mental computation of 2.4 + 1.9/2. Ultimately, the application of working memory leads to a different and more effortful decision than in Fig. 5 (top). This example illustrates how significant amounts of working memory can be used at early stages of the decision-making process and produce downstream effects and more considered responses. In the following sections, we provide a selective review of work on decision making with visualizations that demonstrates direct and indirect evidence for our proposed model.
To determine if there is cross-domain empirical support for a dual-process account of decision making with visualizations, we selectively reviewed studies of complex decision making with computer-generated two-dimensional (2D) static visualizations. To illustrate the application of a dual-process account of decision making to visualization research, this review highlights representative studies from diverse application areas. Interdisciplinary groups conducted many of these studies and, as such, it is not accurate to classify the studies in a single discipline. However, to help the reader evaluate the cross-domain nature of these findings, Table 1 includes the application area for the specific tasks used in each study.

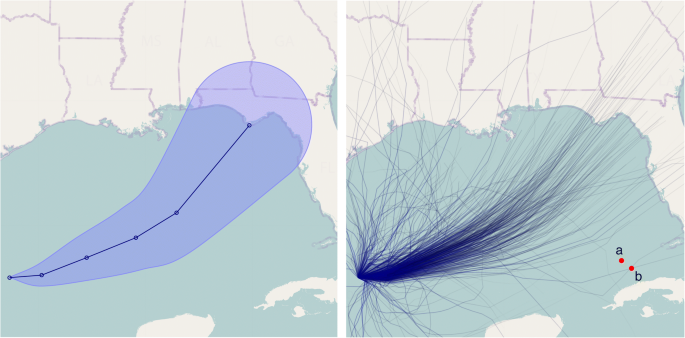
A more direct test of visualizations guiding bottom-up attention is to examine if salient information biases viewers’ judgments. One method involves identifying salient features using a behaviorally validated saliency model, which predicts the locations that will attract viewers’ bottom-up attention (Harel, 2015; Itti, Koch, & Niebur, 1998; Rosenholtz & Jin, 2005). In one study, researchers compared participants’ judgments with different hurricane forecast visualizations and then, using the Itti et al. (1998) saliency algorithm, found that the differences in what was salient in the two visualizations correlated with participants’ performance (Padilla, Ruginski et al., 2017). Specifically, they suggested that the salient borders of the Cone of Uncertainty (see Fig. 7, left), which is used by the National Hurricane Center to display hurricane track forecasts, leads some people to incorrectly believe that the hurricane is growing in physical size, which is a misunderstanding of the probability distribution of hurricane paths that the cone is intended to represent (Padilla, Ruginski et al., 2017; see also Ruginski et al., 2016). Further, they found that when the same data were represented as individual hurricane paths, such that there was no salient boundary (see Fig. 7, right), viewers intuited the probability of hurricane paths more effectively than the Cone of Uncertainty. However, an individual hurricane path biased viewers’ judgments if it intersected a point of interest. For example, in Fig. 7 (right), participants accurately judged that locations closer to the densely populated lines (highest likelihood of storm path) would receive more damage. This correct judgment changed when a location farther from the center of the storm was intersected by a path, but the closer location was not (see locations a and b in Fig. 7 right). With both visualizations, the researchers found that viewers were negatively biased by the salient features for some tasks (Padilla, Ruginski et al., 2017; Ruginski et al., 2016).
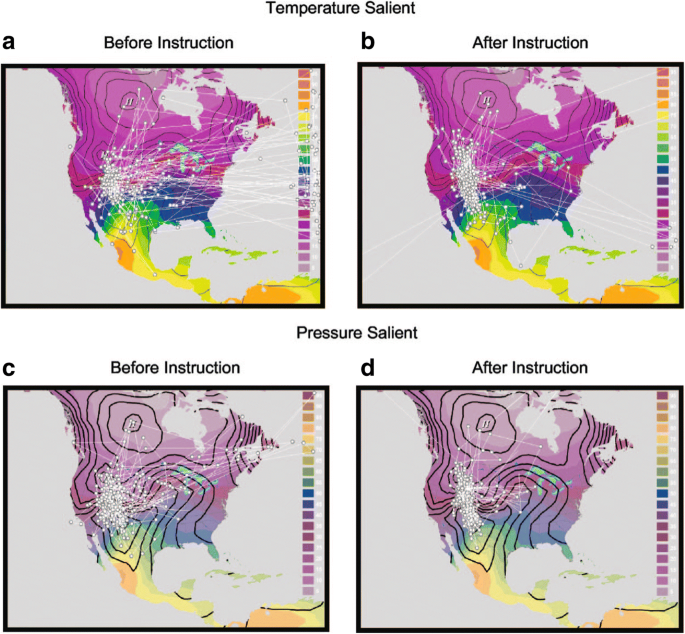
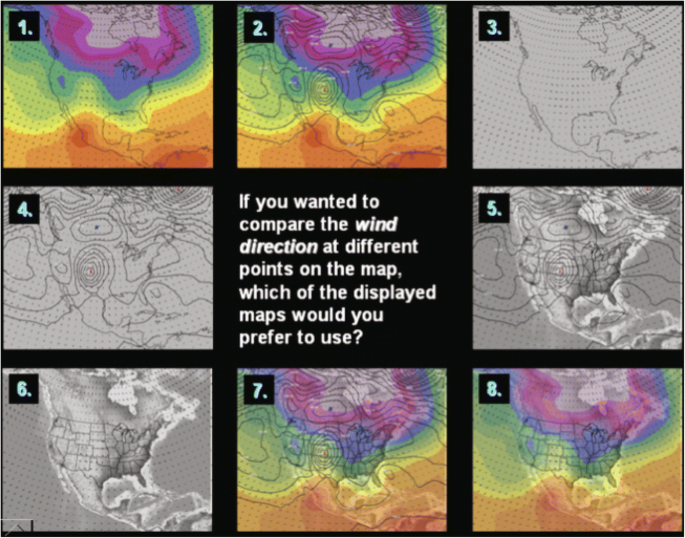
That is not to say that saliency only negatively impacts decisions. When incorporated into visualization design, saliency can guide bottom-up attention to task-relevant information, thereby improving performance (e.g. Fabrikant et al., 2010; Fagerlin, Wang, & Ubel, 2005; Hegarty et al., 2010; Schirillo & Stone, 2005; Stone et al., 2003; Waters, Weinstein, Colditz, & Emmons, 2007). One compelling example using both eye-tracking measures and a saliency algorithm demonstrated that salient features of weather maps directed viewers’ attention to different variables that were visualized on the maps (Hegarty et al., 2010) (see also Fabrikant et al., 2010). Interestingly, when the researchers manipulated the relative salience of temperature versus pressure (see Fig. 8), the salient features captured viewers’ overt attention (as measured by eye fixations) but did not influence performance, until participants were trained on how to effectively interpret the features. Once viewers were trained, their judgments were facilitated when the relevant features were more salient (Hegarty et al., 2010). This is an instructive example of how saliency may direct viewers’ bottom-up attention but may not influence their performance until viewers have the relevant top-down knowledge to capitalize on the affordances of the visualization.
In sum, the reviewed studies suggest that bottom-up attention has a profound influence on decision making with visualizations. This is noteworthy because bottom-up attention is a Type 1 process. At a minimum, the work suggests that Type 1 processing influences the first stages of decision making with visualizations. Further, the studies cited in this section provide support for the inclusion of bottom-up attention in our proposed model.
A second cross-domain finding that relates to Type 1 processing is that visualizations can give rise to visual-spatial biases that can be either beneficial or detrimental to decision making. We are proposing the new concept of visual-spatial biases and defining this term as a bias that elicits heuristics, which are a direct result of the visual encoding technique. Visual-spatial biases likely originate as a Type 1 process as we suspect they are connected to bottom-up attention, and if detrimental to decision making, have to be actively suppressed by top-down knowledge and cognitive control mechanisms (see Table 4 for summary of biases documented in this section). Visual-spatial biases can also improve decision-making performance. As Card, Mackinlay, and Shneiderman (1999) point out, we can use vision to think, meaning that visualizations can capitalize on visual perception to interpret a visualization without effort when the visual biases elucidated by the visualization are consistent with the correct interpretation.
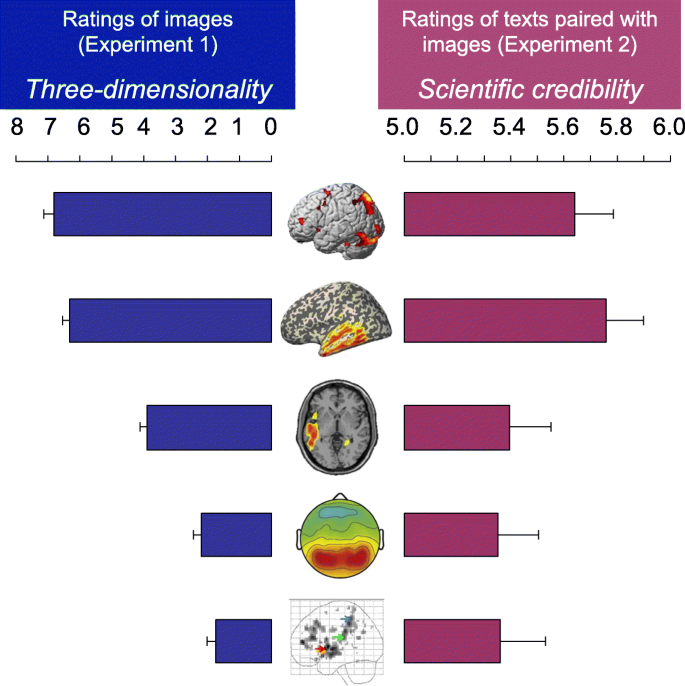
We argue that visual-spatial biases reflect a Type 1 process, occurring automatically with minimal working memory. Work by Sanchez and Wiley (2006) provides direct evidence for this assertion using eye-tracking data to demonstrate that individuals with less working memory capacity attend to irrelevant images in a scientific article more than those with greater working memory capacity. The authors argue that we are naturally drawn to images (particularly high-quality depictions) and that significant working memory capacity is required to shift focus away from images that are task-irrelevant. The ease by which visualizations captivate our focus and direct our bottom-up attention to specific features likely increases the impact of these biases, which may be why some visual-spatial biases are notoriously difficult to override using working memory capacity (see Belia et al., 2005; Boone, Gunalp, & Hegarty, in press; Joslyn & LeClerc, 2013; Newman & Scholl, 2012). We speculate that some visual-spatial biases are intertwined with bottom-up attention—occurring early in the decision-making process and influencing the down-stream processes (see our model in Fig. 4 for reference), making them particularly unremitting.
We also observe a cross-domain finding involving Type 2 processing, which suggests that if there is a mismatch between the visualization and a decision-making component, working memory is used to perform corrective mental transformations. Cognitive fit is a term used to describe the correspondence between the visualization and conceptual question or task (see our model for reference; for an overview of cognitive fit, see Vessey, Zhang, & Galletta, 2006). Those interested in examining cognitive fit generally attempt to identify and reduce mismatches between the visualization and one of the decision-making components (see Table 5 for a breakdown of the decision-making components that the reviewed studies evaluated). When there is a mismatch produced by the default Type 1 processing, it is argued that significant working memory (Type 2 processing) is required to resolve the discrepancy via mental transformations (Vessey et al., 2006). As working memory is capacity limited, the magnitude of mental transformation or amount of working memory required is one predictor of reaction times and errors.
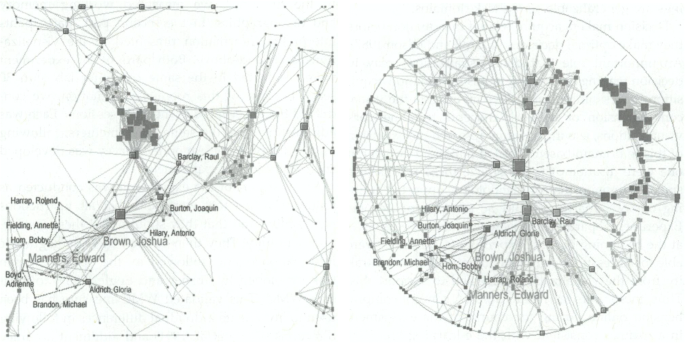
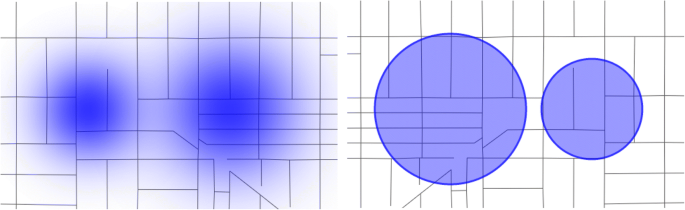
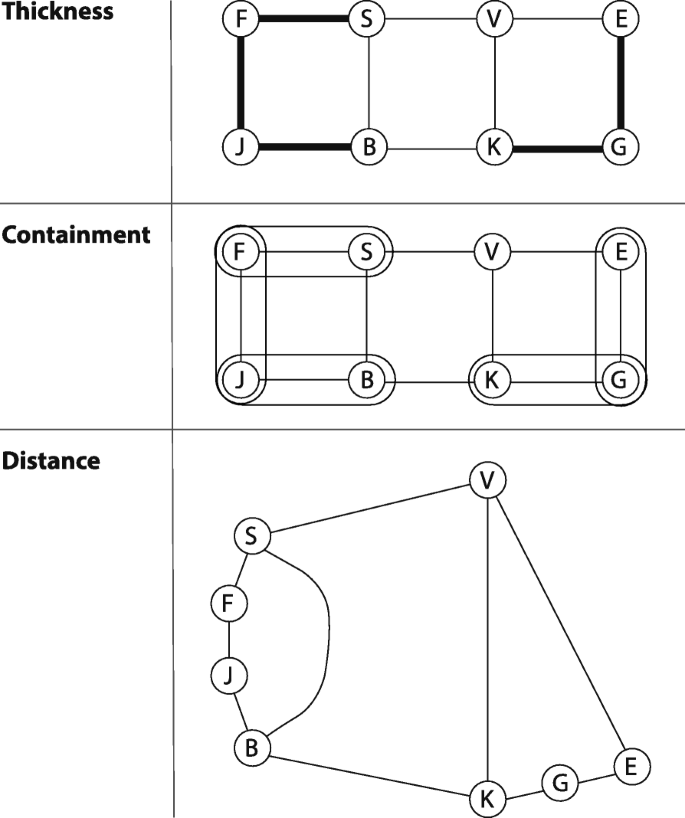
As illustrated in our model, working memory can be recruited to aid all stages of the decision-making process except bottom-up attention. Work that examines cognitive fit theory provides indirect evidence that working memory is required to resolve conflicts in the schema matching and a decision-making component. For example, one way that a mismatch between a viewer’s mental schema and visualization can arise is when the viewer uses a schema that is not optimal for the task. Tversky, Corter, Yu, Mason, and Nickerson (2012) primed participants to use different schemas by describing the connections in Fig. 14 in terms of either transfer speed or security levels. Participants then decided on the most efficient or secure route for information to travel between computer nodes with either a visualization that encoded data using the thickness of connections, containment, or physical distance (see Fig. 14). Tversky et al. (2012) found that when the links were described based on their information transfer speed, thickness and distance visualizations were the most effective—suggesting that the speed mental schema was most closely matched to the thickness and distance visualizations, whereas the speed schema required mental transformations to align with the containment visualization. Similarly, the thickness and containment visualizations outperformed the distance visualization when the nodes were described as belonging to specific systems with different security levels. This work and others (Feeney, Hola, Liversedge, Findlay, & Metcalf, 2000; Gattis & Holyoak, 1996; Joslyn & LeClerc, 2013; Smelcer & Carmel, 1997) provides indirect evidence that gratuitous realignment between mental schema and the visualization can be error-prone and visualization designers should work to reduce the number of transformations required in the decision-making process.
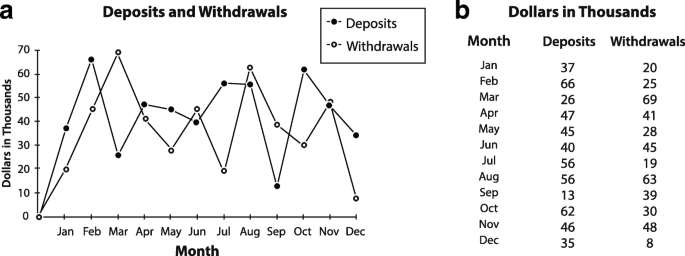
Researchers from multiple domains have also documented cases of misalignment between the task, or conceptual question, and the visualization. For example, Vessey and Galletta (1991) found that participants completed a financial-based task faster when the visualization they chose (graph or table, see Fig. 15) matched the task (spatial or textual). For the spatial task, participants decided which month had the greatest difference between deposits and withdrawals. The textual or symbolic tasks involved reporting specific deposit and withdrawal amounts for various months. The authors argued that when there is a mismatch between the task and visualization, the additional transformation accounts for the increased time taken to complete the task (Vessey & Galletta, 1991) (see also Dennis & Carte, 1998; Huang et al., 2006), which likely takes place in the inference process of our proposed model.
The aforementioned studies provide direct (Zhu & Watts, 2010) and indirect (Dennis & Carte, 1998; Feeney et al., 2000; Gattis & Holyoak, 1996; Huang et al., 2006; Joslyn & LeClerc, 2013; Smelcer & Carmel, 1997; Tversky et al., 2012; Vessey & Galletta, 1991) evidence that Type 2 processing recruits working memory to resolve misalignment between decision-making processes and the visualization that arise from default Type 1 processing. These examples of Type 2 processing using working memory to perform effortful mental computations are consistent with the assertions of Evans and Stanovich (2013) that Type 2 processes enact goal directed complex processing. However, it is not clear from the reviewed work how exactly the visualization and decision-making components are matched. Newman and Scholl (2012) propose that we match the schema and visualization based on the similarities between the salient visual features, although this proposal has not been tested. Further, work that assesses cognitive fit in terms of the visualization and task only examines the alignment of broad categories (i.e., spatial or semantic). Beyond these broad classifications, it is not clear how to predict if a task and visualization are aligned. In sum, there is not a sufficient cross-disciplinary theory for how mental schemas and tasks are matched to visualizations. However, it is apparent from the reviewed work that Type 2 processes (requiring working memory) can be recruited during the schema matching and inference processes.
In a review of map-reading cognition, Lobben (2004) states, “…research should focus not only on the needs of the map reader but also on their map-reading skills and abilities” (p. 271). In line with this statement, the final cross-domain finding is that the effects of knowledge can interact with the affordances or biases inherent in the visualization method. Knowledge may be held temporally in working memory (Type 2), held in long-term knowledge but effortfully used (Type 2), or held in long-term knowledge but automatically applied (Type 1). As a result, knowledge-driven processing can involve either Type 1 or Type 2 processes.
Both short- and long-term knowledge can influence visualization affordances and biases. However, it is difficult to distinguish whether Type 2 processing is using significant working memory capacity to temporarily hold knowledge or if participants have stored the relevant knowledge in long-term memory and processing is more automatic. Complicating the issue, knowledge stored in long-term memory can influence decision making with visualizations using both Type 1 and 2 processing. For example, if you try to remember Pythagorean’s Theorem, which you may have learned in high school or middle school, you may recall that a 2 + b 2 = c 2 , where c represents the length of the hypotenuse and a and b represent the lengths of the other two sides of a triangle. Unless you use geometry regularly, you likely had to strenuously search in long-term memory for the equation, which is a Type 2 process and requires significant working memory capacity. In contrast, if you are asked to recall your childhood phone number, the number might automatically come to mind with minimal working memory required (Type 1 processing).
In this section, we highlight cases where knowledge either influenced decision making with visualizations or was present but did not influence decisions (see Table 6 for the type of knowledge examined in each study). These studies are organized based on how much time the viewers had to incorporate the knowledge (i.e. short-term instructions and long-term individual differences in abilities and expertise), which may be indicative of where the knowledge is stored. However, many factors other than time influence the process of transferring knowledge by working memory capacity to long-term knowledge. Therefore, each of the studies cited in this section could be either Type 1, Type 2, or both types of processing.
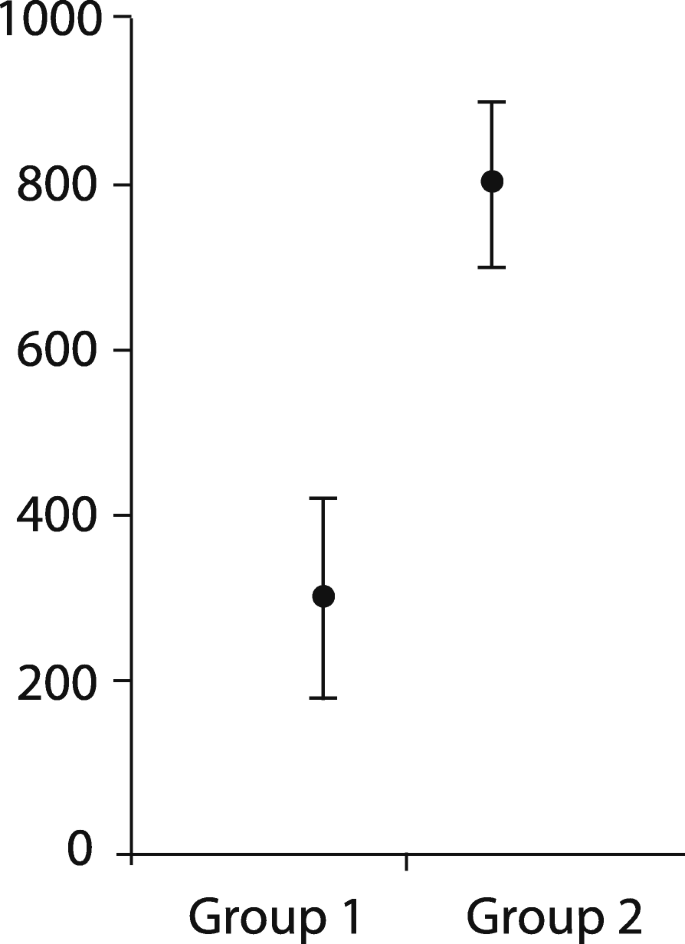
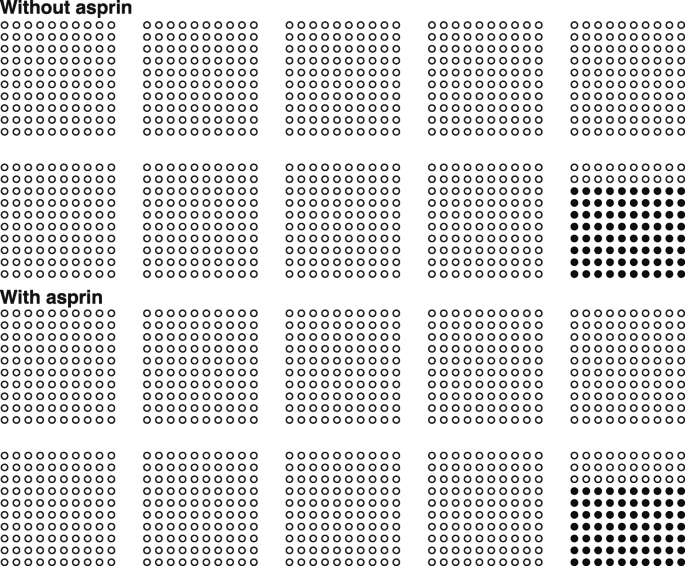
Regarding longer-term knowledge, there is substantial evidence that individual differences in knowledge impact decision making with visualizations. For example, numerous studies document the benefit of visualizations for individuals with less health literacy, graph literacy, and numeracy (Galesic & Garcia-Retamero, 2011; Galesic, Garcia-Retamero, & Gigerenzer, 2009; Keller, Siegrist, & Visschers, 2009; Okan, Galesic, & Garcia-Retamero, 2015; Okan, Garcia-Retamero, Cokely, & Maldonado, 2012; Okan, Garcia-Retamero, Galesic, & Cokely, 2012; Reyna, Nelson, Han, & Dieckmann, 2009; Rodríguez et al., 2013). Visual depictions of health data are particularly useful because health data often take the form of probabilities, which are unintuitive. Visualizations inherently illustrate probabilities (i.e. 10%) as natural frequencies (i.e. 10 out of 100), which are more intuitive (Hoffrage & Gigerenzer, 1998). Further, by depicting natural frequencies visually (see example in Fig. 17), viewers can make perceptual comparisons rather than mathematical calculations. This dual benefit is likely the reason visualizations produce facilitation for individuals with less health literacy, graph literacy, and numeracy.
These studies are good examples of how designers can create visualizations that capitalize on Type 1 processing to help viewers accurately make decisions with complex data even when they lack relevant knowledge. Based on the reviewed work, we speculate that well-designed visualizations that utilize Type 1 processing to intuitively illustrate task-relevant relationships in the data may be particularly beneficial for individuals with less numeracy and graph literacy, even for simple tasks. However, poorly designed visualizations that require superfluous mental transformations may be detrimental to the same individuals. Further, individual differences in expertise, such as graph literacy, which have received more attention in healthcare communication (Galesic & Garcia-Retamero, 2011; Nayak et al., 2016; Okan et al., 2015; Okan, Garcia-Retamero, Cokely, & Maldonado, 2012; Okan, Garcia-Retamero, Galesic, & Cokely, 2012; Rodríguez et al., 2013), may play a large role in how viewers complete even simple tasks in other domains such as map-reading (Kinkeldey et al., 2017).
Less consistent are findings on how more experienced users incorporate knowledge acquired over longer periods of time to make decisions with visualizations. Some research finds that students’ decision-making and spatial abilities improved during a semester-long course on Geographic Information Science (GIS) (Lee & Bednarz, 2009). Other work finds that experts perform the same as novices (Riveiro, 2016), experts can exhibit visual-spatial biases (St. John et al., 2001) and experts perform more poorly than expected in their domain of visual expertise (Belia et al., 2005). This inconsistency may be due in part to the difficulty in identifying when and if more experienced viewers are automatically applying their knowledge or employing working memory. For example, it is unclear if the students in the GIS course documented by Lee and Bednarz (2009) developed automatic responses (Type 1) or if they learned the information and used working memory capacity to apply their training (Type 2).
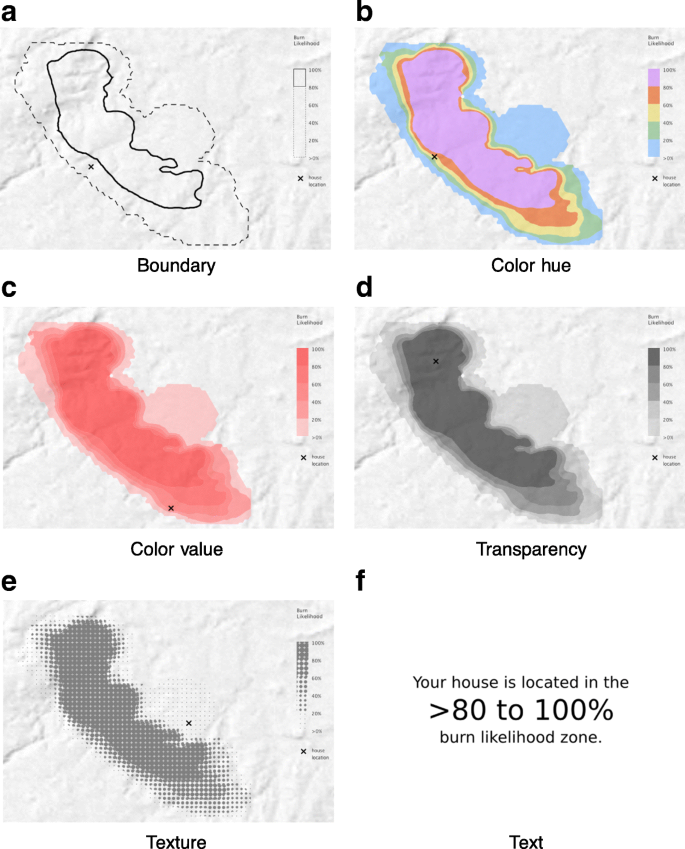
Cheong et al. (2016) offer one way to gauge how performance may change when one is forced to use Type 1 processing, but then allowed to use Type 2 processing. In a wildfire task using multiple depictions of uncertainty (see Fig. 18), Cheong et al. (2016) found that the type of uncertainty visualization mattered when participants had to make fast Type 1 decisions (5 s) about evacuating from a wildfire. But when given sufficient time to make Type 2 decisions (30 s), participants were not influenced by the visualization technique (see also Wilkening & Fabrikant, 2011).
Interesting future work could limit experts’ time to complete a task (forcing Type 1 processing) and then determine if their judgments change when given more time to complete the task (allowing for Type 2 processing). To test this possibility further, a dual-task paradigm could be used such that experts’ working memory capacity is depleted by a difficult secondary task that also required working memory capacity. Some examples of secondary tasks in a dual-task paradigm include span tasks that require participants to remember or follow patterns of information, while completing the primary task, then report the remembered or relevant information from the pattern (for a full description of theoretical bases for a dual-task paradigm see Pashler, 1994). To our knowledge, only one study has used a dual-task paradigm to evaluate cognitive load of a visualization decision-making task (Bandlow et al., 2011). However, a growing body of research on other domains, such as wayfinding and spatial cognition, demonstrates the utility of using dual-task paradigms to understand the types of working memory that users employ for a task (Caffò, Picucci, Di Masi, & Bosco, 2011; Meilinger, Knauff, & Bülthoff, 2008; Ratliff & Newcombe, 2005; Trueswell & Papafragou, 2010).
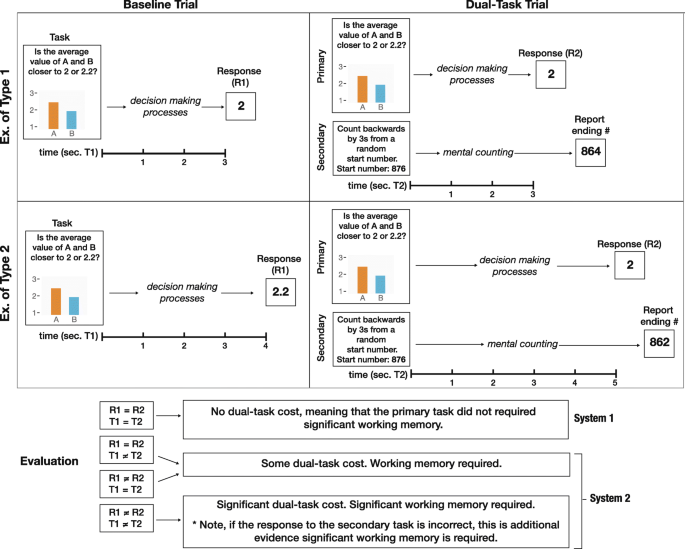
Span tasks are examples of spatial or verbal secondary tasks, which include remembering the orientations of an arrow (taxes visual-spatial memory, (Shah & Miyake, 1996) or counting backward by 3 s (taxes verbal processing and short-term memory) (Castro, Strayer, Matzke, & Heathcote, 2018). One should expect more interference if the primary and secondary tasks recruit the same processes (i.e. visual-spatial primary task paired with a visual-spatial memory span task). An example of such an experimental design is illustrated in Fig. 19. In the dual-task trial illustrated in Fig. 19, if participants responses are as fast and accurate as the baseline trial then participants are likely not using significant amounts of working memory capacity for that task. If the task does require significant working memory capacity, then the inclusion of the secondary task should increase the time taken to complete the primary task and potentially produce errors in both the secondary and primary tasks. In visualization decision-making research, this is an open area of exploration for researchers and designers that are interested in understanding how working memory capacity and a dual-process account of decision making applies to their visualizations and application domains.
In sum, this section documents cases where knowledge-driven processing does and does not influence decision making with visualizations. Notably, we describe numerous studies where well-designed visualizations (capitalizing on Type 1 processing) focus viewers’ attention on task-relevant relationships in the data, which improves decision accuracy for individuals with less developed health literacy, graph literacy, and numeracy. However, the current work does not test how knowledge-driven processing maps on to the dual-process model of decision making. Knowledge may be held temporally by working memory capacity (Type 2), held in long-term knowledge but strenuously utilized (Type 2), or held in long-term knowledge but automatically applied (Type 1). More work is needed to understand if a dual-process account of decision making accurately describes the influence of knowledge-driven processing on decision making with visualizations. Finally, we detailed an example of a dual-task paradigm as one way to evaluate if viewers are employing Type 1 processing.
Throughout this review, we have provided significant direct and indirect evidence that a dual-process account of decision making effectively describes prior findings from numerous domains interested in visualization decision making. The reviewed work provides support for specific processes in our proposed model including the influences of working memory, bottom-up attention, schema matching, inference processes, and decision making. Further, we identified key commonalities in the reviewed work relating to Type 1 and Type 2 processing, which we added to our proposed visualization decision-making model. The first is that utilizing Type 1 processing, visualizations serve to direct participants’ bottom-up attention to specific information, which can be either beneficial or detrimental for decision making (Fabrikant et al., 2010; Fagerlin et al., 2005; Hegarty et al., 2010; Hegarty et al., 2016; Padilla, Ruginski et al., 2017; Ruginski et al., 2016; Schirillo & Stone, 2005; Stone et al., 1997; Stone et al., 2003; Waters et al., 2007). Consistent with assertions from cognitive science and scientific visualization (Munzner, 2014), we propose that visualization designers should identify the critical information needed for a task and use a visual encoding technique that directs participants’ attention to this information. We encourage visualization designers who are interested in determining which elements in their visualizations will likely attract viewers’ bottom-up attention, to see the Itti et al. (1998) saliency model, which has been validated with eye-tracking measures (for implementation of this model along with Matlab code see Padilla, Ruginski et al., 2017). If deliberate effort is not made to capitalize on Type 1 processing by focusing the viewer’s attention on task-relevant information, then the viewer will likely focus on distractors via Type 1 processing, resulting in poor decision outcomes.
A second cross-domain finding is the introduction of a new concept, visual-spatial biases, which can also be both beneficial and detrimental to decision making. We define this term as a bias that elicits heuristics, which is a direct result of the visual encoding technique. We provide numerous examples of visual-spatial biases across domains (for implementation of this model along with Matlab code, see Padilla, Ruginski et al., 2017). The novel utility of identifying visual-spatial biases is that they potentially arise early in the decision-making process during bottom-up attention, thus influencing the entire downstream process, whereas standard heuristics do not exclusively occur at the first stage of decision making. This possibly accounts for the fact that visual-spatial biases have proven difficult to overcome (Belia et al., 2005; Grounds et al., 2017; Joslyn & LeClerc, 2013; Liu et al., 2016; McKenzie et al., 2016; Newman & Scholl, 2012; Padilla, Ruginski et al., 2017; Ruginski et al., 2016). Work by Tversky (2011) presents a taxonomy of visual-spatial communications that are intrinsically related to thought, which are likely the bases for visual-spatial biases.
We have also revealed cross-domain findings involving Type 2 processing, which suggest that if there is a mismatch between the visualization and a decision-making component, working memory is used to perform corrective mental transformations. In scenarios where the visualization is aligned with the mental schema and task, performance is fast and accurate (Joslyn & LeClerc, 2013). The types of mismatches observed in the reviewed literature are likely both domain-specific and domain-general. For example, situations where viewers employ the correct graph schema for the visualization, but the graph schema does not align with the task, are likely domain-specific (Dennis & Carte, 1998; Frownfelter-Lohrke, 1998; Gattis & Holyoak, 1996; Huang et al., 2006; Joslyn & LeClerc, 2013; Smelcer & Carmel, 1997; Tversky et al., 2012). However, other work demonstrates cases where viewers employ a graph schema that does not match the visualization, which is likely domain-general (e.g. Feeney et al., 2000; Gattis & Holyoak, 1996; Tversky et al., 2012). In these cases, viewers could accidentally use the wrong graph schema because it appears to match the visualization or they might not have learned a relevant schema. The likelihood of viewers making attribution errors because they do not know the corresponding schema increases when the visualization is less common, such as with uncertainty visualizations. When there is a mismatch, additional working memory is required resulting in increased time taken to complete the task and in some cases errors (e.g. Joslyn & LeClerc, 2013; McKenzie et al., 2016; Padilla, Ruginski et al., 2017). Based on these findings, we recommend that visualization designers should aim to create visualizations that most closely align with a viewer’s mental schema and task. However, additional empirical research is required to understand the nature of the alignment processes, including the exact method we use to mentally select a schema and the classifications of tasks that match visualizations.
The final cross-domain finding is that knowledge-driven processes can interact or override effects of visualization methods. We find that short-term (Dennis & Carte, 1998; Feeney et al., 2000; Gattis & Holyoak, 1996; Joslyn & LeClerc, 2013; Smelcer & Carmel, 1997; Tversky et al., 2012) and long-term knowledge acquisition (Shen et al., 2012) can influence decision making with visualizations. However, there are also examples of knowledge having little influence on decisions, even when prior knowledge could be used to improve performance (Galesic et al., 2009; Galesic & Garcia-Retamero, 2011; Keller et al., 2009; Lee & Bednarz, 2009; Okan et al., 2015; Okan, Garcia-Retamero, Cokely, & Maldonado, 2012; Okan, Garcia-Retamero, Galesic, & Cokely, 2012; Reyna et al., 2009; Rodríguez et al., 2013). We point out that prior knowledge seems to have more of an effect on non-visual-spatial biases, such as a familiarity bias (Belia et al., 2005; Joslyn & LeClerc, 2013; Riveiro, 2016; St. John et al., 2001), which suggests that visual-spatial biases may be closely related to bottom-up attention. Further, it is unclear from the reviewed work when knowledge switches from relying on working memory capacity for application to automatic application. We argue that Type 1 and 2 processing have unique advantages and disadvantages for visualization decision making. Therefore, it is valuable to understand which process users are applying for specific tasks in order to make visualizations that elicit optimal performance. In the case of experts and long-term knowledge, we propose that one interesting way to test if users are utilizing significant working memory capacity is to employ a dual-task paradigm (illustrated in Fig. 19). A dual-task paradigm can be used to evaluate the amount of working memory required and compare the relative working memory required between competing visualization techniques.
We have also proposed a variety of practical recommendations for visualization designers based on the empirical findings and our cognitive framework. Below is a summary list of our recommendations along with relevant section numbers for reference:
We use visual information to inform many important decisions. To develop visualizations that account for real-life decision making, we must understand how and why we come to conclusions with visual information. We propose a dual-process cognitive framework expanding on visualization comprehension theory that is supported by empirical studies to describe the process of decision making with visualizations. We offer practical recommendations for visualization designers that take into account human decision-making processes. Finally, we propose a new avenue of research focused on the influence of visual-spatial biases on decision making.